

Poniżej przedstawiamy kolejne odpowiedzi do testów z akademii google analytics. Poniżej odpowiedzi dla kursu google analytics for power users. Testy dostępne są tylko w języku angielskim. Poniższe odpowiedzi służą do analizowania swojej wiedzy. Do pomocy w nauce a nie używania ich jako ściągi. Na naszej stronie pozostałe kursy i odpowiedzi z akademii google analytics
TEST 1
1. When viewing the Mobile Overview report below and comparing „Made a Purchase” and „Didn’t make a purchase” segments, which conclusion is recommended?
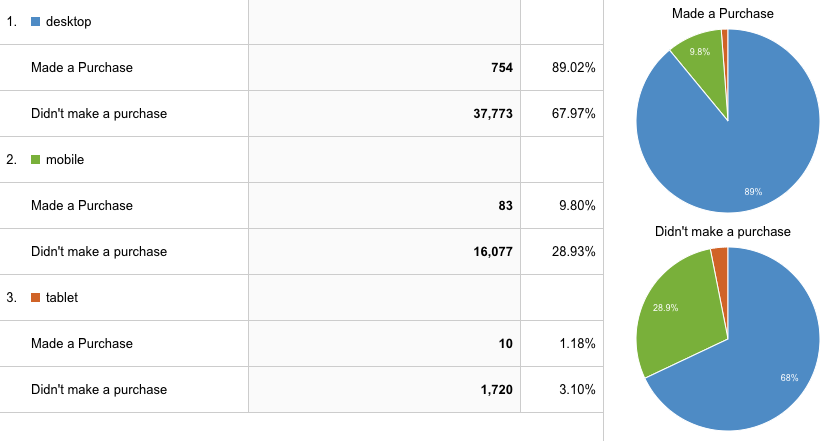
Most users who converted were using desktop.
The Google Store should optimize their site for tablet.
The Google Store shouldn’t bother developing for mobile.
There must be an issue with the checkout flow on desktop.
2. Which report, without additional configuration, shows e-commerce conversion rates for users on Tablets?
Conversions > Ecommerce > Overview
Audience > Mobile > Overview
Audience > Cross-Device > Device Paths
Audience > Mobile > Devices
3. Which feature enables you to analyze up to 3 dimensions at once?
Explorer report
Primary dimension
Pivot table
Table filter
4. Which setting do you use to change the metric displayed in the table?
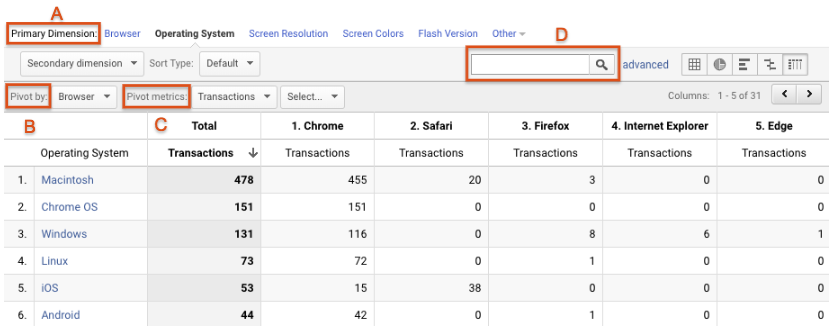
A
B
C
D
TEST 2
1. If one of your site’s paid traffic sources had a low ecommerce conversion rate, which actions should you take? (select two)
Immediately stop investing in marketing for the source.
Immediately increase marketing spend for the source.
Determine whether the traffic source fulfills other site goals.
Determine whether the source assists in conversions.
2. You have a goal configured for newsletter signups. You want to determine which traffic sources are sending you the most users who’ve signed up for your newsletter. In this All Traffic report, which setting should you adjust to find this data?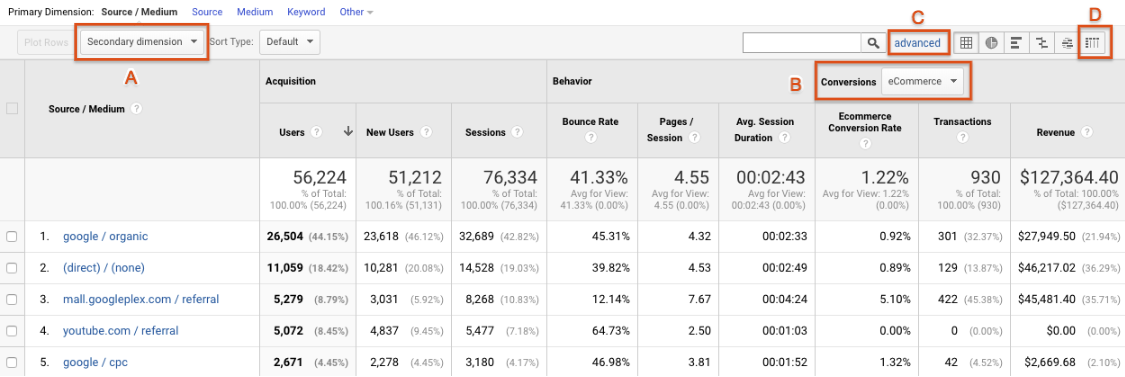
A
B
C
D
3. How would you view data for Revenue, Transactions, and Average Order Value per traffic source?
View the All Traffic > Source/Medium report and select „Ecommerce” in the Explorer tab.
View the Ecommerce > Sales Performance report and add Source/Medium as a secondary dimension.
View the Ecommerce > Overview report and select „Avg. Order Value” as a metric in the time graph.
View the Mobile > Overview report and select „Ecommerce” in the Explorer tab.
4. In this Channels report, we’ve clicked into the Referral channel. What are the two top sources of users in the Referral channel?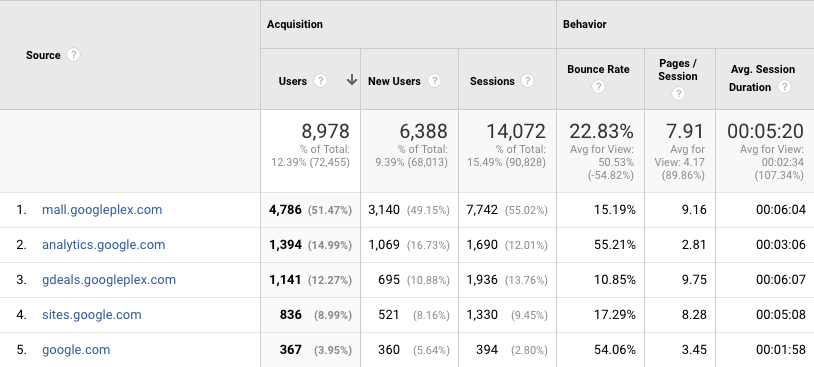
Organic Search and Social
Youtube.com and Mall.googleplex.com
Mall.googleplex.com and Analytics.google.com
Google and Direct
5. What does “(Other)” indicate in the Channels report? (select two)
(Other) sessions have no campaign value attached to them.
(Other) sessions have no source value attached to them.
(Other) sessions cannot be categorized in any of the channels in this channel grouping.
Investigate (Other) to see if sessions could be categorized by defining a new channel.
6. Where can you view a heatmap reporting users by time of day?
Analytics > Home
Analytics > Audience
Analytics > Acquisition
Analytics > Real-Time
7. You’re running an email promotion providing a discount to users with a birthday in the month of September. What metrics and dimensions should you include in a custom report to determine the day and time when users are most likely to complete a purchase?
Users, Time, Day
Day Index, Hour, Sessions
Hour of Day, Sessions, Transactions
Day of Week, Hour, Ecommerce Conversion Rate, Sessions
TEST 3
1. When used as a content site KPI, what does a high Average Time on Page indicate about a specific page’s performance?
Strong performance: Users are highly engaged with the page.
Poor performance: Users are struggling with the page.
It depends on the specific page and its purpose.
Average Time on Page should never be used as a KPI for a content site.
2. In what scenario would you use a custom metric?
To track the number of minutes played for each video on your site
To find out the average number of pageviews per user
To see how often a page was the landing page for sessions including that page
To record the title of a video watched on your site
3. What can be used to measure scroll depth in Google Analytics?
A custom dimension
Event tracking
Scroll Depth is a standard Google Analytics metric.
It’s not possible to track scroll depth with Google Analytics.
4. When tracking both ecommerce and goals, what are two ways to analyze Page Value based only on ecommerce? (select two)
Use a table filter to exclude goal pages.
Define a segment to exclude sessions where a goal occurred.
Create a view that tracks ecommerce but doesn’t define any goals.
Assign goal values based on average revenue calculated outside of Google Analytics.
5. Assuming that ecommerce tracking and/or goals are configured, which of the following Analytics reports does NOT show conversion rates?
Landing Pages
All Pages
Source/Medium
Mobile Overview
6. What are two benefits of the Reverse Goal Path report? (select two)
Discover common goal paths you may not have considered.
Identify top goal paths and optimize navigation or messaging for even more conversions.
Identify drop-off points between steps in various goal paths.
Automatically track conversions without manually configuring goals.
7. How could you compare the conversion rate for when the „About Us” page was viewed versus when the page was not viewed?
Compare „About Us” page metrics in the Landing Pages report with „About Us” page metrics in the All Pages report.
Identify the Page Value for the „About Us” page and compare this metric across all other pages.
Create a custom segment including sessions with visits to the „About Us” page, and another segment for sessions where users did not visit the „About Us” page. Apply the two segments to the Ecommerce Overview report and compare conversion rates.
Use the Reverse Goal Path report to compare number of goal completions among rows including the „About Us” page.
TEST 4
1. What actions must you take to enable Enhanced Ecommerce in Google Analytics? (select two)
Implement Enhanced Ecommerce on your website.
Enable Enhanced Ecommerce Reporting in your Analytics view.
Enable Checkout Labeling in Ecommerce settings.
Assign values to all Analytics goals.
2. What can the Product List Performance report be used for? (select three)
Identify a list of products to remove from your website.
Identify low performing Product Lists for optimization opportunities.
Analyze how the order of products in a product list may impact performance.
Compare product performance across multiple Product Lists.
3. In this Product List Performance report, which product list and list position is most efficient at driving product clicks?
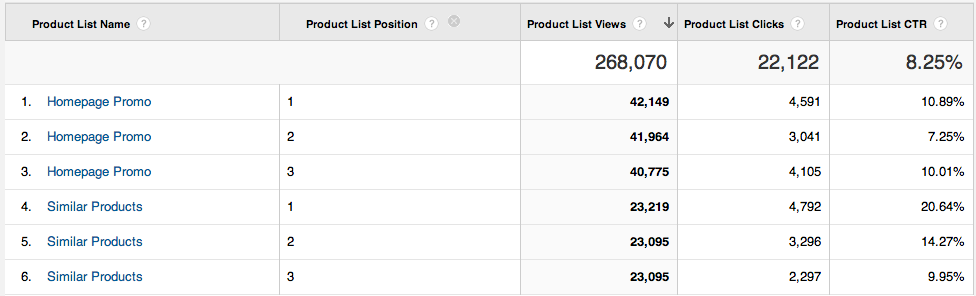
Position 1 on the Homepage Promo list
Position 1 on the Similar Products list
Position 3 on the Homepage Promo list
Position 3 on the Similar Products list
4. You’re evaluating whether high resolution product images on product detail pages is worth the investment. What metric tells you how often a product was purchased after its detail page was viewed?
Cart-to-Detail Rate
Buy-to-Detail Rate
Average Price
Product Adds
5. In this Product Performance report, which product indicates potential issues with the product details page?
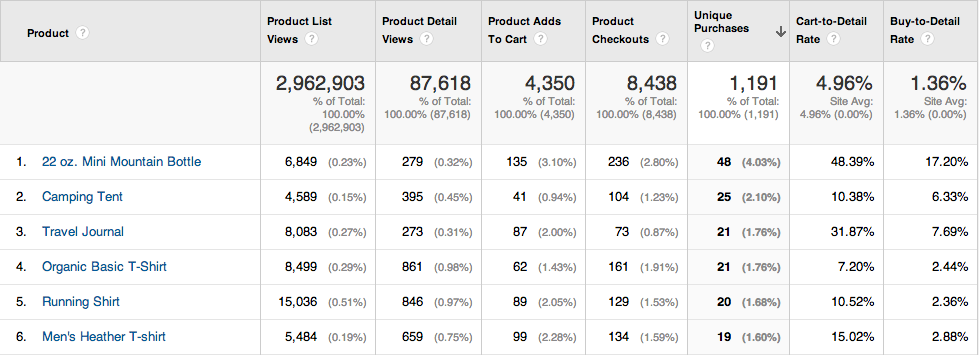
22 oz. Mini Mountain Bottle
Travel Journal
Organic Basic T-Shirt
Men’s Heather T-Shirt
6. What can the Shopping Behavior Analysis report tell you? (select two)
How users moved from one stage of purchasing to the next.
Where users abandoned the shopping funnel.
Errors on the „Billing and Shipping” page.
Top channels driving sessions with check-outs.
7. In this Checkout Behavior Analysis report, which step in the checkout process should you optimize based on its drop-off rate?
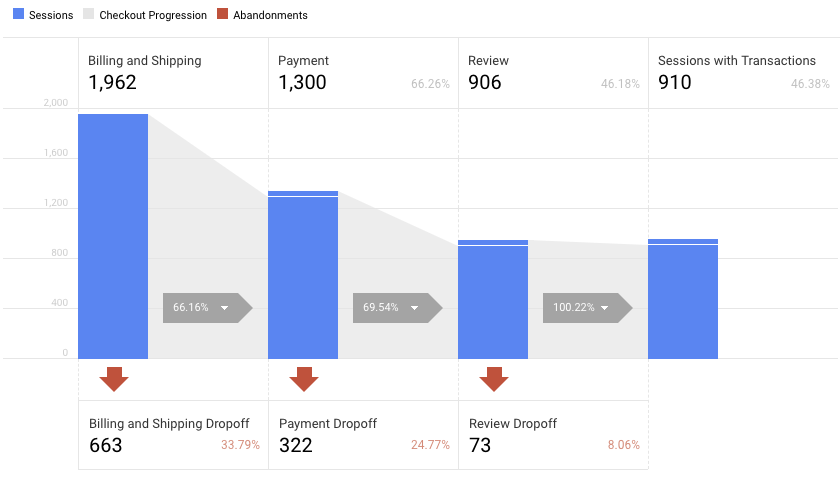
Billing and Shipping
Payment
Review
Sessions with Transactions
8. Which report would you use to build a segment of users who abandoned a specific step of the checkout path?
Shopping Behavior Analysis
Product Performance
Ecommerce Overview
Checkout Behavior Analysis
9. You decide to run a landing page experiment to test a new carousel which highlights your top performing products. Which two reports could you use to determine which products to highlight? (select two)
Shopping Behavior Analysis
Product Performance
Ecommerce Overview
Sales Performance
Pozostałe kursy z akademii Google Analytics
Google Analytics dla zaawansowanych
Google Analytics 360
Introduction to Data Studio
Google Analytics dla poczatkujących
Podstawy Menedżera Tagów